August 2025 – April evoked Ferris Bueller; will Q4 evoke Groundhog Day?
2025 has been a year of 1990s film nostalgia. In the spring, it was the tariff scene from Ferris Bueller’s Day Off. Over the summer, I have been thinking about another 1990s film — Groundhog Day. The premise is Bill Murray has become caught in a time loop on February 2nd, Groundhog Day, which he relives repeatedly. The time loop becomes a source of growing frustration and anxiety to him until he embraces and escapes it. Late 2025 may feel like a Groundhog Day time loop for three reasons.
· First, Team Transitory has got its bench refilled (both inside and outside the Fed) and is again arguing for Fed rate cuts as opposed to bringing inflation durably back to target;
· Second, risks related to liquidity conditions in the US banking sector will grow into mid-September and the fall; and
· Third, Fed balance sheet shrinkage may end and expansion resume.
Let’s review these three items in turn.
First, there seems to be a new Team Transitory. In 2020, simultaneous monetary and fiscal stimulus was well intended but coupled with Covid supply shocks resulted in inflation that was more than transitory. US CPI reached 9% and inflation has remained stubbornly above target. In 2022 Research Affiliates published a piece —“History Lessons: How Transitory Is Inflation?”— which analyzed periods of elevated inflation (>4%) in OECD economies. The authors had the temerity to suggest that it could take longer for US inflation to return to acceptable levels than many expected. The authors found 52 instances when inflation rose above 4 percent in OECD countries (1970-2022) –
· the best quintile of outcomes in these cases was for inflation to revert to 2 percent in a year or less;
· the median outcome — a 2 1/2 year wait for inflation to revert to 2 percent; and
· the worst quintile — a wait of more than 10 years for inflation to return to target.
The US experience (4+ years of above target inflation, so far) already is a worse outcome than the OECD historical median experience after inflation rises above 4% (2 1/2 years of above target inflation). It is possible that tariffs and reduced immigration’s contraction of the US labor force will be transitory boosts to US inflation. But history also suggests that it is plausible that US inflation being above target could become more protracted still. Stated differently, 4+ years of above target inflation is not very far in the tail of negative historical outcomes (>10 years is the worst quintile or 20 percent of outcomes).
As I discussed in my January column, the Administration started off 2025 with a plan to shift some of the cost of US government debt service to foreigners through tariffs revenue. Modest tariffs perhaps could have been mostly offset through US dollar appreciation/fx deprecation. In such a case, the burden of tariff would have fallen more on exporters, akin to what happened during the first Trump Administration’s imposition of tariffs in 2018 (left red circle).
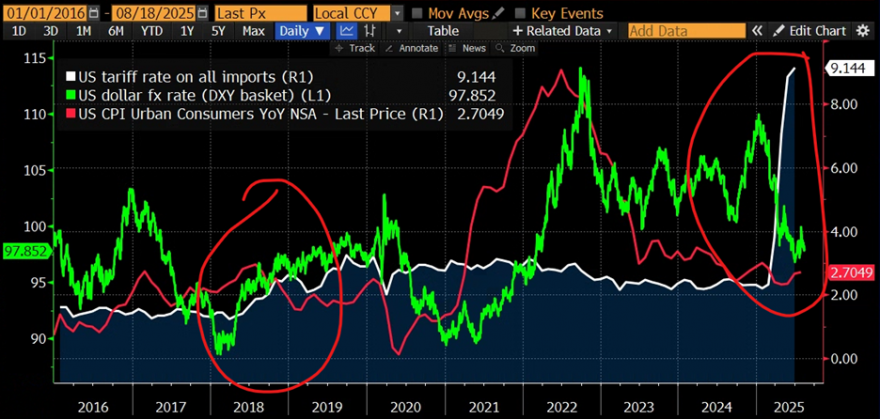
However, tariffs rates are being raised to more elevated levels because more revenue is sought to help offset planned tax cuts associated with the 2025 OBBBA. The US dollar has depreciated by roughly 10 percent since the start of 2025 (right red circle). As a result, the effects of tariffs fall mostly on the US economy, reducing US domestic consumption, while also raising prices. Both Piper Sandler and Goldman Sachs estimate US consumers will bear ~ 2/3 of the impact of tariffs, exporters about 10-15% of the impact, with the balance falling on US corporate earnings.
So the impact of this new round of tariffs (plus reduced US immigration) is to raise the price level. At the same time, there is evidence of weakness in US labor markets, including federal government, manufacturing, construction, agriculture, transportation, and energy. Team Transitory 2.0 concludes that the FOMC should cut interest rates at the September 2025 FOMC meeting — just like the FOMC cut rates in September 2024. Maybe even entertain a 50 bps rate cut in September — wow, Groundhog Day!
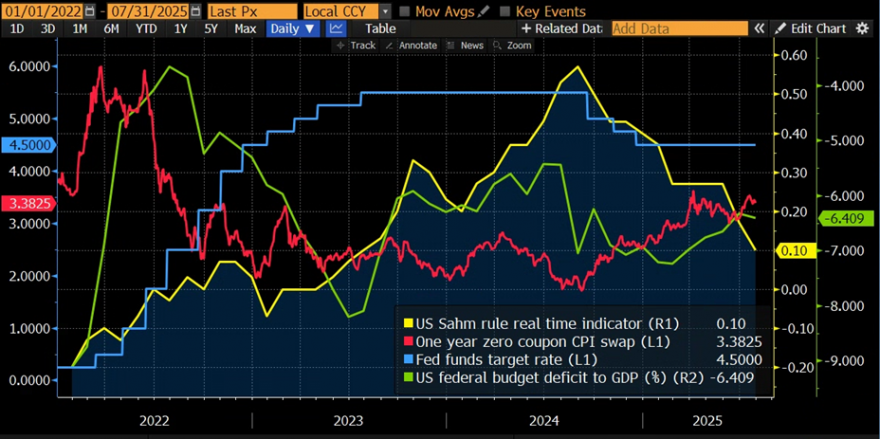
However, as the chart above shows, one year CPI swaps (red line) were trading near 2% in September 2024 while the Sahm rule (yellow line) had been breached (0.50 is the relevant level indicating elevated recession risk). The problem with the 50 bps September 2024 Fed rate which I criticized in my Sept 2024 column was that the Fed was easing (blue line) into government fiscal stimulus (green line) ahead of 2024 elections even as US inflation had still not gotten back to target. The 10-year Treasury yield rose significantly in Q4 2024, offsetting Fed easing.
Focusing on 2025, the chart shows one year CPI swaps (red line) at 3.4% — significantly more elevated than in September 2024, while the Sahm rule (yellow line) is at 0.1%, i.e., nowhere near recessionary levels.
It is true that we have had some net fiscal tightening (green line) in H1 2025. However, 2025 OBBBA effects will come through with a lag. The IRS earlier this month announced that it would delay making changes to tax tables related to OBBBA, such as the deduction for overtime and tips, and information on OBBBA changes to depreciation rules. This implies that OBBBA 2025 tax cuts will come through in H1 2026 as tax refunds and an extra fiscal impulse – I am hearing numbers of 0.3-0.4% of GDP — not modeled by CBO (ahead of the mid-term elections). Monetary policy acts with long and variable lags. So effectively the doves propose hitting the economy with simultaneous monetary and fiscal stimulus in H1 2026. Should we expect the 10-year Treasury yield to respond differently to Fed rate cuts in 2025 relative to 2024? Only if we have a shift from QT to QE on the horizon.
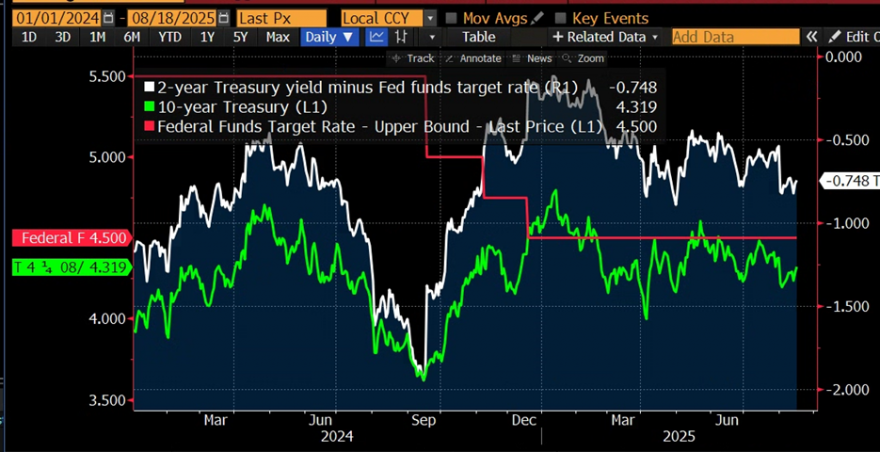
Some rate cut proponents have argued that the Treasury market is signaling that the Fed should cut rates with the yield on the 2-year Treasury about 75 bps below the Fed funds rate (white line). But in September 2024 the 2-year note was trading almost 200 bps below the Fed funds rate. Nonetheless, the 10-year Treasury yield (green line) and term premia rose after Q4 2024 Fed rate cuts (red line) – with long-dated Treasuries judging the Sept 2024 rate cuts a policy error. The 2-year note yield can better be thought of as reflecting what markets expect policymakers will do, not what policymakers should do. There has been ample public jawboning from doves to create market expectations of Fed rate cuts in Q4 2025, even if the risk is that Fed rate cuts near term prove to be poor policy.
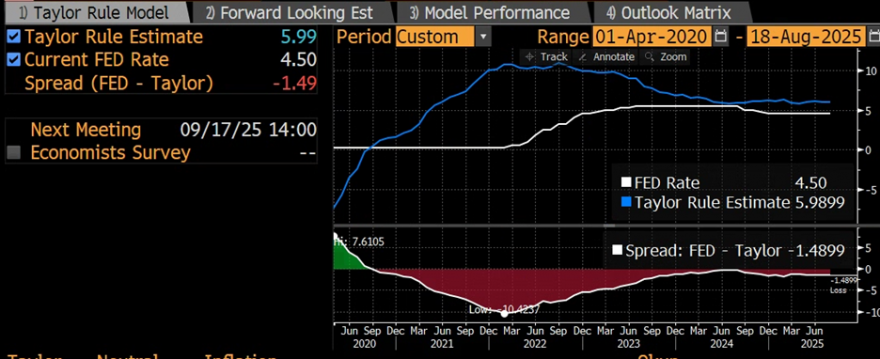
Let’s ground the discussion of appropriate Fed policy a bit further. The current estimate of the basis between the Fed funds rate and where a Taylor rule might suggest the Fed funds rate should be is -149 bps.
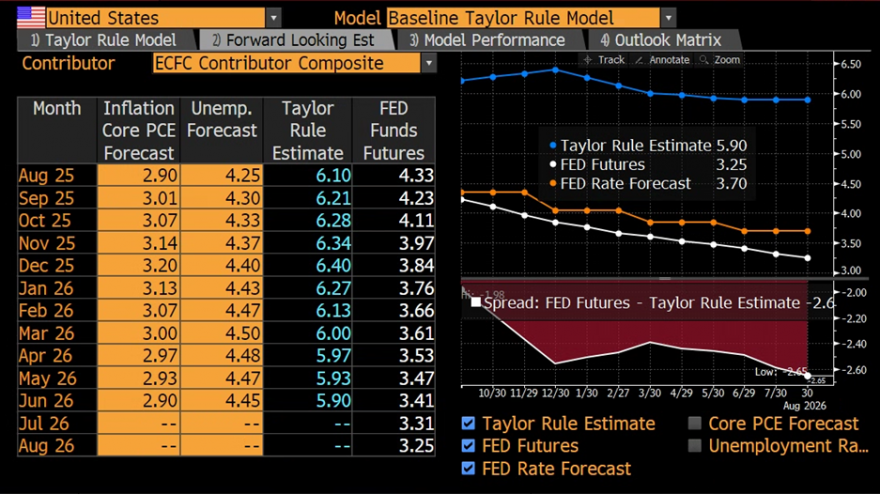
Current consensus economic forecasts used in a Taylor rule suggest if forecasts and what is priced in for Fed fund future both were realized that would imply the FOMC permitting its divergence from a Taylor rule to widen by ~100 bps to 256 bps by year end 2025, increasing risks to an upside inflation miss.
So, let’s recap. Team Transitory 2.0 is effectively arguing for Fed rate cuts when
· US inflation remains above target and is projected to rise;
· US inflation expectations are at more risk of becoming unanchored because inflation has been above target for 4+ years (see gold and crypto);
· market based measures of short-term inflation expectations are almost 150 bps higher than Sept 2024;
· US employment risks arguably are less evident than Sept 2024;
· monetary policy acts with a lag and fiscal policy will turn stimulative in H1 2026 as a result of 2025 tax refunds being large due to lack of IRS OBBBA guidance; and
· the distribution of historical OECD inflation outcomes suggests even at 4+ years above target it is plausible for inflation to remain elevated for several years more.
Excessive certitude about the potential impacts of economic policy can prove costly – like inflation running above target for years. Someone recently said to me that if you move far enough to the left or right you will find that you have traveled in a circle and end up in sort of the same place – kind of like a Groundhog Day time loop.
The second Q4 time loop is revisiting 2018 and 2023 bank liquidity/money market funding strains. I wrote about this topic at length in July. My incremental thoughts are:
– Wow -no one even asked about the Committee’s plans re: QT at the July FOMC press conference.
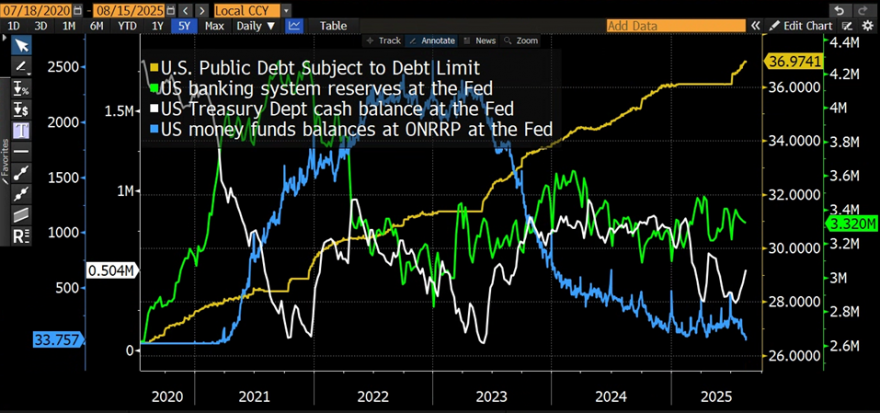
– Debt limit is now over and US government debt has grown almost $1 trillion (yellow line) since July 4th. The US Treasury announced at the July Quarterly Refunding that it would rebuild the cash balance at the Fed (white line) to $800 by end of September. This fairly rapid rebuild of Treasury cash at the Fed will pressure US banking system reserves (green line) lower.
– The September 15th corporate tax payments coming into the Treasury are a key date to watch and come after the September FOMC meeting. A setup that feels like a potential timeloop of repo market challenges during QT1 in 2018 that ultimately ended QT.
– Doves jawboning about Fed rate cuts have encouraged both money funds to move cash out of the Fed’s ON RRP facility (blue line) which is now empty and unable to buffer bank reserves from the pressure of QT. Rate cut expectations have also caused term repo rates to fall relative to overnight repo rates. A hawkish repricing of market expectations for the Fed’s policy path could cause ON RRP balances to rise, pressuring bank reserves at the Fed. The $3 trillion mark where SVB failed in the spring of 2023 is important to watch. A hawkish repricing of Fed expectations could also cause more repo funding to shift to overnight repo and increase money market volatility.
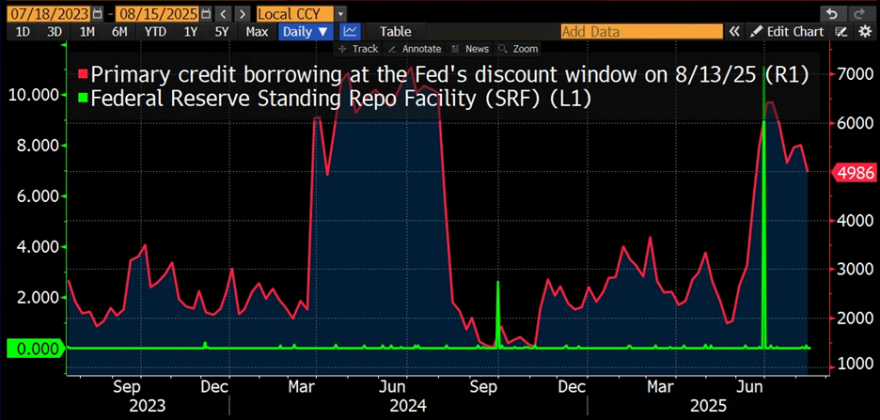
– Continue also to watch what happens with banks’ use of the standing repo facility (green line) and discount window (red line) ahead. Both the SRF and discount window are bank borrowings from the Fed and increase bank interest expense. Bank reserves at the Fed which are a bank asset and source of bank income.
A third potential Q4 time loop would be the end of QT and potential restart of QE or worse yet YCC. The future of unconventional monetary policy is one of the most important and under-discussed topics in analyzing candidates for the next Fed Chair. Some Fed Chair candidates have advocated for limiting the Fed’s use of its balance sheet. Other Fed Chair candidates have spoken about potential yield curve control (YCC), i.e., buying unlimited quantities of government securities to pin the 10-year Treasury at a specific yield level. When the time comes to end QT — which is soon – the question is what next for the Fed’s balance sheet?
Given the abysmal results of unconventional monetary globally and its negative effects on the US banking sector, insufficient attention is being paid to this crucial issue. Using Japan as a guide, YCC could be anticipated to significantly reduce the exchange value of the US dollar, cause capital to flow out of the US, and reduce US living standards. The Bank of Japan’s very large holdings of long-dated JGBs means the BOJ cannot meaningfully raise interest rates to address above target inflation without incurring significant operating losses on these long duration bonds. While the other two time loops – Team Transitory 2.0 and bank liquidity strains — would be unpleasant, I am most concerned if the US cannot break the unconventional monetary policy easing time loop.
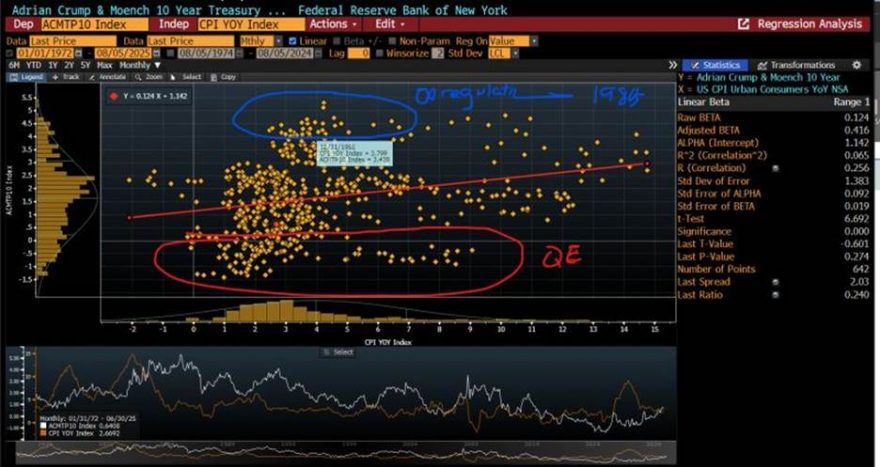
The chart below is of the 10-year Treasury term premia vs US CPI y/y NSA from 1972 (since Preisdent Nixon took the US fully off the gold standard) to the present. The small red dot are current data. The points circled in red occurred during the post GFC period of unconventional monetary policy and illustrate how the relationship between Treasury term premia and inflation became broken, arguably contributing to a sense among policymakers that highly expansionary fiscal policy is free.
Wishing Treasury Talk readers good luck in positioning their banks for an eventful Q4 ahead with the potential for several Groundhog Day moments (10-year Treasury yields rise on Fed rate cuts, pressure on bank funding and potential end to QT). To my A&M students, I look forward to seeing you next week!